Nissan Safari Engine Replacement Cost in UAE: Understanding the Warning Signs Before Catastrophic Failure

June 9, 2026
Most catastrophic engine failures do not begin with catastrophe.
They begin with something small.
A slight increase in coolant temperature.
A little more oil consumption than usual.
A faint mechanical noise that appears only occasionally.
An owner notices it.
Then ignores it.
A workshop mentions it.
Then the repair is postponed.
Months pass.
Sometimes years.
The engine continues running.
Confidence grows.
The concern fades.
Then one day the vehicle overheats, loses compression, develops bearing damage or suffers a major internal failure.
The owner is often shocked.
The engine is not.
Because the failure started long before the breakdown occurred.
This is especially relevant for the Nissan Safari.
Across Dubai, Abu Dhabi, Sharjah, Ajman, Ras Al Khaimah, Fujairah and Umm Al Quwain, Nissan Safari models continue operating in some of the harshest automotive conditions found anywhere in the world.
Extreme heat.
Heavy towing.
Desert driving.
Long-distance highway journeys.
Urban traffic congestion.
High cooling-system loads.
These vehicles are respected for their durability.
But durability should never be mistaken for immunity.
Every mechanical system follows a failure pathway.
The question is whether the owner recognises the warning signs before the engine reaches the final stage.
The objective of preventive failure analysis is simple:
Identify the problem before the problem identifies itself.
Why Most Nissan Safari Engine Replacements Begin Months Before the Actual Failure Occurs
Engine failures are often misunderstood.
Many owners imagine a sudden event.
A dramatic breakdown.
A single moment.
In reality, most replacement-engine projects begin long before the vehicle stops moving.
Failure develops gradually.
Typical Failure Timeline
Stage One:
- Minor symptom
- Minimal financial exposure
- Simple repair opportunity
Stage Two:
- Growing deterioration
- Increased mechanical stress
- Multiple warning indicators
Stage Three:
- Reliability decline
- Secondary system damage
- Escalating repair costs
Stage Four:
- Internal engine damage
- Major repair discussion
Stage Five:
- Replacement-engine requirement
Failure Progression Matrix
| Failure Stage | Typical Cost Exposure (AED) |
| Early Detection | 500 – 4,000 |
| Moderate Repair | 3,000 – 10,000 |
| Major Mechanical Repair | 10,000 – 25,000 |
| Engine Rebuild | 15,000 – 35,000 |
| Engine Replacement | 18,000 – 60,000+ |
The most affordable stage is rarely the last one.
That is the central lesson of preventive failure analysis.
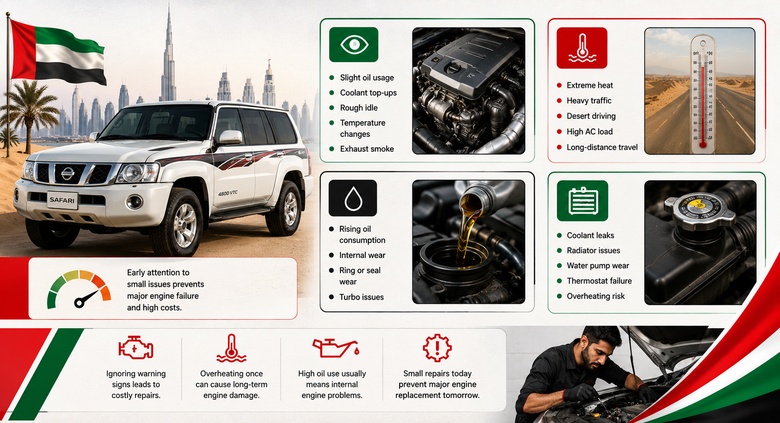
Early Warning Signs Nissan Safari Owners Should Never Ignore in UAE Conditions
Most catastrophic failures provide warning.
The challenge is recognising the warning while intervention remains affordable.
Common Early Indicators
- Increasing oil consumption
- Repeated coolant top-ups
- Hard starting
- Rough idle
- Reduced power
- Temperature fluctuations
- Exhaust smoke
- Engine knocking
- Reduced fuel efficiency
Individually, these symptoms may appear insignificant.
Collectively, they often indicate a developing reliability issue.
Risk Assessment Table
| Symptom | Failure Risk |
| Occasional Oil Consumption | Low |
| Consistent Oil Consumption | Moderate |
| Temperature Variation | Moderate |
| Repeated Overheating | High |
| Knock or Rattle | High |
| Compression Loss | Very High |
The earlier these symptoms are investigated, the larger the number of available solutions.
How UAE Heat Accelerates Engine Stress and Failure Progression in Nissan Safari Models
The UAE climate changes the equation.
A Nissan Safari operating in the Gulf experiences environmental pressures many global markets never encounter.
Heat-Related Stress Factors
- High ambient temperatures
- Increased cooling-system demand
- Long idling periods
- Desert operating conditions
- Air-conditioning loads
- Extended highway driving
Each factor increases thermal stress.
Thermal stress increases wear.
Wear increases failure probability.
Components Most Affected
| Component | UAE Stress Level |
| Radiator | Very High |
| Water Pump | Very High |
| Thermostat | High |
| Engine Oil | High |
| Cooling Hoses | High |
| Head Gasket | High |
| Sensors | Moderate |
The climate itself does not cause failure.
It accelerates existing weaknesses.
Oil Consumption Patterns That Often Signal Internal Engine Wear
Oil consumption is one of the most valuable diagnostic indicators available to owners.
Yet it is also one of the most commonly ignored.
Many drivers simply add oil and continue driving.
That approach addresses the symptom.
Not the cause.
Possible Causes of Increasing Oil Consumption
- Piston-ring wear
- Cylinder-wall wear
- Valve-seal deterioration
- Turbocharger issues
- Internal leakage
Consumption Trend Analysis
| Consumption Pattern | Reliability Outlook |
| Stable | Positive |
| Gradually Increasing | Monitor Closely |
| Rapidly Increasing | High Concern |
| Excessive Consumption | Immediate Investigation |
The trend matters more than the quantity.
A sudden increase often deserves attention.
Financial Comparison
Ignoring Consumption:
- Additional wear
- Higher failure risk
- Larger repair exposure
Investigating Early:
- Diagnostic costs
- Preventive maintenance
- Lower long-term financial risk
Cooling-System Failures and Their Role in Triggering Catastrophic Engine Damage
If preventive failure analysis had a primary suspect, it would often be the cooling system.
Many replacement-engine projects begin with a cooling issue.
Then evolve into something much larger.
Common Cooling-System Failures
- Radiator deterioration
- Coolant leaks
- Water-pump wear
- Thermostat failure
- Blocked passages
- Hose deterioration
Failure Escalation Example
Minor Coolant Leak
↓
Reduced Cooling Efficiency
↓
Repeated Temperature Increases
↓
Overheating Event
↓
Head-Gasket Damage
↓
Internal Engine Damage
↓
Replacement Engine
The progression appears dramatic.
But it frequently occurs over months rather than days.
Cooling-System Cost Comparison
| Repair Type | Typical Cost (AED) |
| Hose Replacement | 200 – 1,000 |
| Thermostat Replacement | 300 – 1,500 |
| Water Pump Replacement | 600 – 3,500 |
| Radiator Replacement | 1,000 – 5,000 |
| Head-Gasket Repair | 5,000 – 20,000 |
| Engine Replacement | 18,000 – 60,000+ |
A small cooling-system repair can sometimes prevent a very large engine invoice.
Overheating Events: Why a Single Incident Can Create Long-Term Engine Consequences
One of the most dangerous assumptions owners make is believing an engine has recovered simply because it continues running after overheating.
Mechanical damage is not always immediate.
Sometimes it develops later.
Potential Consequences of Overheating
- Head-gasket weakening
- Cylinder-head distortion
- Lubrication degradation
- Seal deterioration
- Compression loss
The vehicle may continue operating.
The deterioration may continue as well.
Overheating Severity Matrix
| Event Type | Long-Term Risk |
| Mild Temperature Increase | Low |
| Repeated Temperature Increase | Moderate |
| Significant Overheating | High |
| Severe Overheating | Very High |
The absence of immediate failure should never be interpreted as the absence of damage.
The First Financial Mistake Most Owners Make After Warning Signs Appear
The first mistake is rarely ignoring the symptom.
Most owners notice the symptom.
The first mistake is underestimating its significance.
The engine still starts.
The vehicle still drives.
The problem appears manageable.
That perception creates delay.
And delay creates risk.
Cost-of-Delay Illustration
Immediate Investigation:
- Diagnostic Testing
- Preventive Repairs
- Controlled Costs
Delayed Investigation:
- Escalated Damage
- Secondary Failures
- Larger Financial Exposure
Example Ownership Outcomes
| Response Strategy | Estimated Financial Exposure |
| Early Intervention | 500 – 5,000 AED |
| Delayed Repair | 5,000 – 20,000 AED |
| Major Failure | 20,000 – 60,000+ AED |
The most expensive failures often begin with the least expensive symptoms.
That observation sits at the heart of preventive failure analysis.
Because catastrophic engine failures rarely arrive without warning.
The warning signs almost always appear first.
The real question is whether they are recognised before the replacement-engine conversation becomes unavoidable.
Compression Loss Analysis: The Hidden Reliability Indicator Many Owners Overlook
Engine failures often become visible only after internal deterioration has already advanced significantly.
Compression testing helps reveal those problems earlier.
It measures the engine's ability to seal combustion pressure inside each cylinder.
Healthy compression generally indicates healthy internal sealing.
Declining compression often suggests developing mechanical wear.
Common Causes of Compression Loss
- Piston-ring wear
- Cylinder-wall wear
- Valve-seat damage
- Burnt valves
- Head-gasket failure
- Cylinder-head distortion
The problem is that compression loss rarely announces itself dramatically at first.
Instead, it quietly influences performance.
Early Compression-Loss Symptoms
- Reduced power
- Hard starting
- Rough idle
- Poor fuel economy
- Increased oil consumption
Compression-Risk Matrix
| Compression Condition | Reliability Outlook |
| Uniform & Healthy | Strong |
| Minor Variation | Monitor |
| Moderate Variation | Investigate |
| Significant Variation | High Risk |
| Multiple Weak Cylinders | Critical |
Many replacement-engine projects could potentially have been predicted months earlier through proper diagnostic testing.
Exhaust Smoke, Engine Noise and Performance Changes as Predictive Failure Indicators
Engines often communicate distress.
Not with warning lights.
With behaviour.
Smoke.
Noise.
Performance changes.
These signals frequently appear before major failures occur.
Smoke Analysis
Blue Smoke
Possible Causes:
- Oil burning
- Ring wear
- Valve-seal deterioration
White Smoke
Possible Causes:
- Coolant intrusion
- Head-gasket concerns
Black Smoke
Possible Causes:
- Fuel-system imbalance
- Air-intake issues
- Injector problems
Noise Analysis
| Noise Type | Possible Cause |
| Light Tick | Valve Train |
| Deep Knock | Bearing Wear |
| Rattle | Timing Components |
| Whistle | Intake or Turbo Issues |
| Grinding | Severe Mechanical Damage |
The key principle is simple.
The engine often provides warnings long before it provides failure.
Failure Escalation Mapping: How Minor Repairs Become Major Engine-Replacement Projects
Preventive failure analysis focuses heavily on escalation pathways.
Because catastrophic failures rarely begin catastrophically.
Example Escalation Pathway
Minor Coolant Leak
↓
Coolant Loss
↓
Temperature Increase
↓
Repeated Thermal Stress
↓
Head-Gasket Damage
↓
Compression Loss
↓
Internal Engine Wear
↓
Replacement Engine
At each stage, intervention remains possible.
The difference lies in cost.
Escalation Cost Comparison
| Failure Stage | Typical Cost (AED) |
| Leak Repair | 300 – 1,500 |
| Cooling-System Repair | 1,000 – 5,000 |
| Head-Gasket Repair | 5,000 – 20,000 |
| Engine Rebuild | 15,000 – 35,000 |
| Engine Replacement | 18,000 – 60,000+ |
The further the failure progresses, the fewer affordable options remain available.
The Cost-of-Delay Matrix: Comparing Early Intervention, Major Repair and Replacement Costs
Owners often postpone action because they wish to avoid spending money.
Ironically, delayed decisions frequently increase spending.
Early Intervention Scenario
Typical Repairs:
- Cooling-system service
- Sensor replacement
- Minor leak repairs
Estimated Cost:
AED 500 – 5,000
Intermediate Repair Scenario
Typical Repairs:
- Head-gasket replacement
- Major cooling-system repairs
- Valve-train work
Estimated Cost:
AED 5,000 – 20,000
Advanced Repair Scenario
Typical Repairs:
- Internal engine repairs
- Extensive labour
- Multiple supporting components
Estimated Cost:
AED 15,000 – 35,000
Replacement Engine Scenario
Typical Costs:
AED 18,000 – 60,000+
Financial Escalation Matrix
| Decision Timing | Cost Exposure |
| Immediate Action | Lowest |
| Moderate Delay | Moderate |
| Significant Delay | High |
| Catastrophic Failure | Highest |
Failure becomes expensive because options disappear.
Not because engines suddenly become costly.
Turbocharger, Fuel-System and Supporting-Part Failures That Often Accompany Engine Deterioration
Engines rarely fail alone.
Supporting systems often participate.
Or suffer collateral damage.
Common Secondary Failure Areas
- Turbocharger systems
- Fuel injectors
- Cooling systems
- Sensors
- Oil coolers
- Intake systems
These systems frequently create confusion.
Owners focus on symptoms.
The root cause remains elsewhere.
Secondary Damage Cost Estimates
| Component | Typical Cost (AED) |
| Turbocharger | 3,000 – 15,000 |
| Fuel Injectors | 1,500 – 10,000 |
| Oil Cooler | 800 – 5,000 |
| Sensors | 300 – 3,000 |
| Cooling Components | 500 – 8,000 |
A replacement-engine project often includes much more than the engine itself.
Reliability Trend Analysis: Recognising When a Nissan Safari Has Entered the Failure Zone
Reliability rarely collapses overnight.
Instead, it deteriorates gradually.
The challenge is identifying the trend.
Reliability Indicators
- Increasing workshop visits
- Recurring fault codes
- Rising oil consumption
- Declining fuel efficiency
- Repeated overheating concerns
- Increasing repair frequency
One isolated issue is rarely alarming.
A pattern is.
Reliability Trend Matrix
| Reliability Pattern | Risk Level |
| Stable | Low |
| Occasional Issues | Moderate |
| Repeated Issues | High |
| Escalating Problems | Very High |
| Frequent Failures | Critical |
The moment patterns emerge, preventive analysis becomes essential.
Hidden Damage Often Developing Beneath the Surface
Many catastrophic failures surprise owners because the damage was invisible.
Not because it was absent.
Common Hidden Damage Areas
- Cylinder wear
- Bearing wear
- Valve-seat deterioration
- Cooling-passage restriction
- Internal corrosion
- Head-gasket weakening
The absence of obvious symptoms should never be interpreted as proof of good health.
That assumption becomes expensive.
Hidden-Damage Discovery Matrix
| Hidden Condition | Detection Difficulty |
| Cylinder Wear | Moderate |
| Bearing Wear | High |
| Internal Corrosion | High |
| Valve Damage | Moderate |
| Head-Gasket Weakening | Moderate |
Professional diagnostics exist precisely because many serious problems cannot be seen directly.
Why Owners Frequently Misjudge the Severity of Developing Engine Problems
Human psychology often works against preventive maintenance.
The vehicle still starts.
The engine still runs.
The journey still continues.
Therefore, the problem feels small.
That conclusion is understandable.
And often incorrect.
Common Misjudgements
- "It's only using a little oil."
- "The temperature only rises occasionally."
- "The noise comes and goes."
- "It still drives normally."
Each statement may be true.
Yet each statement can also appear during early-stage failure progression.
Risk Perception Versus Actual Risk
| Owner Perception | Actual Mechanical Risk |
| Minor Concern | Moderate |
| Moderate Concern | High |
| Manageable Issue | Potentially Severe |
| Temporary Symptom | Sometimes Permanent Damage |
The engine does not evaluate problems emotionally.
It follows mechanical reality.
Preventive Failure Analysis Begins With Investigation, Not Assumptions
The strongest Nissan Safari ownership strategies share one characteristic.
They investigate early.
They do not wait for certainty.
They pursue evidence.
Compression tests.
Cooling-system inspections.
Leak-down testing.
Thermal diagnostics.
Service-history analysis.
For owners researching Nissan Safari engine for sale, this distinction becomes especially important.
The objective is not merely identifying replacement options.
The objective is determining whether the failure pathway can still be interrupted before replacement becomes unavoidable.
Because the most affordable engine replacement is often the one that never becomes necessary.
And the most expensive failures frequently begin with symptoms that once appeared harmless.
Hidden Damage Often Discovered During Engine Replacement Projects
One of the most misunderstood aspects of engine replacement is what happens after dismantling begins.
Many owners expect a straightforward process.
Remove the old engine.
Install the replacement.
Continue driving.
Reality is often more complicated.
Once technicians gain access to internal systems, additional damage frequently becomes visible.
Not because it suddenly appeared.
Because it was previously hidden.
Commonly Discovered Hidden Damage
- Engine mount deterioration
- Cooling-system contamination
- Radiator blockage
- Oil-cooler issues
- Wiring deterioration
- Sensor failures
- Transmission-mount wear
- Intake-system contamination
Hidden Cost Analysis
| Additional Repair Item | Typical Cost (AED) |
| Engine Mounts | 800 – 4,000 |
| Radiator Replacement | 1,000 – 5,000 |
| Oil Cooler | 800 – 5,000 |
| Wiring Repairs | 500 – 6,000 |
| Sensors | 300 – 3,000 |
| Cooling-System Restoration | 1,000 – 8,000 |
Many owners assume these expenses increase project costs.
In reality, they often prevent future failures.
The Financial Impact of Continuing to Drive a Mechanically Compromised Nissan Safari
The decision to continue driving after warning signs appear often feels sensible.
The vehicle still moves.
The engine still starts.
Daily life continues uninterrupted.
Yet this period frequently represents the most financially dangerous stage of ownership.
Immediate Consequences
- Increased wear
- Reduced reliability
- Escalating repair exposure
Secondary Consequences
- Supporting-system damage
- Increased downtime
- Reduced resale value
- Higher future labour costs
Delayed-Action Cost Matrix
| Scenario | Estimated Cost Exposure (AED) |
| Early Investigation | 500 – 5,000 |
| Moderate Delay | 5,000 – 15,000 |
| Significant Delay | 15,000 – 35,000 |
| Catastrophic Failure | 20,000 – 60,000+ |
The financial danger often comes from what develops afterwards rather than the original fault itself.
Replace the Engine, Rebuild the Engine or Continue Repairing? A Preventive Failure Decision Framework
Eventually every owner reaches a decision point.
Continue repairing.
Rebuild.
Or replace.
Each option has advantages.
Each option has risks.
Continue Repairing
Suitable When:
- Fault remains isolated
- Internal damage is limited
- Reliability remains stable
Advantages:
- Lower immediate expenditure
Risks:
- Repeated future repairs
- Escalating uncertainty
Engine Rebuild
Suitable When:
- Core engine remains viable
- Damage remains repairable
- Qualified rebuilding expertise exists
Advantages:
- Retains original engine
Risks:
- Variable outcomes
- Extended downtime
Replacement Engine
Suitable When:
- Internal damage is severe
- Reliability has declined significantly
- Long-term ownership is planned
Advantages:
- Greater reliability potential
- Faster route to operational stability
Decision Matrix
| Condition | Recommended Path |
| Minor Internal Wear | Repair |
| Moderate Internal Damage | Rebuild |
| Severe Damage | Replace |
| Multiple Failures | Replace |
| Reliability Collapse | Replace |
The correct decision depends on evidence.
Not optimism.
First-Year Ownership Risks After Engine Replacement and How to Reduce Them
The installation is not the end of the story.
It is the beginning of a new reliability cycle.
The first twelve months matter.
Significantly.
Recommended Post-Installation Actions
- Fluid inspections
- Cooling-system checks
- Leak monitoring
- Diagnostic scans
- Scheduled servicing
Supporting Components Worth Evaluating
- Radiator
- Thermostat
- Water pump
- Cooling hoses
- Engine mounts
- Sensors
First-Year Budget Guide
| Category | Typical Cost (AED) |
| Scheduled Maintenance | 1,000 – 4,000 |
| Fluid Services | 500 – 2,000 |
| Diagnostics | 500 – 2,000 |
| Cooling-System Monitoring | 500 – 3,000 |
| Contingency Reserve | 2,000 – 10,000 |
Preventive ownership after replacement often determines long-term success.
Documentation, Diagnostics and Maintenance Records as Failure-Prevention Tools
Many owners view documentation as paperwork.
Preventive failure analysis views documentation as data.
Data reveals patterns.
Patterns reveal risks.
Essential Records
- Service history
- Compression-test results
- Leak-down reports
- Diagnostic scans
- Repair invoices
- Cooling-system records
Benefits of Proper Documentation
- Faster diagnostics
- Earlier fault detection
- Improved resale value
- Better maintenance planning
Documentation Value Matrix
| Documentation Standard | Reliability Management |
| Comprehensive | Excellent |
| Strong | Good |
| Partial | Moderate |
| Limited | Weak |
| Missing | Poor |
Good records do not prevent failure.
They improve the probability of detecting it early.
UAE Summer Operating Conditions and Their Influence on Future Reliability
A Nissan Safari may perform perfectly during cooler months.
The real test often arrives during summer.
Summer Stress Factors
- High ambient temperatures
- Heavy air-conditioning demand
- Increased cooling-system load
- Desert driving conditions
- Long-distance travel
Components Under Maximum Stress
| Component | Summer Exposure |
| Radiator | Very High |
| Water Pump | Very High |
| Thermostat | High |
| Coolant System | High |
| Engine Oil | High |
This is why many developing faults reveal themselves during UAE summers.
The environment amplifies weaknesses already present.
Buyer Checklist: Evaluating a Nissan Safari Before Engine Failure Becomes Expensive
Preventive failure analysis is not only useful for current owners.
It matters for buyers as well.
Inspection Priorities
- Cooling-system condition
- Oil-consumption history
- Service records
- Diagnostic reports
- Compression testing
- Leak-down testing
- Overheating history
- Repair documentation
High-Risk Indicators
- Repeated coolant loss
- Persistent overheating
- Heavy oil consumption
- Compression imbalance
- Missing service records
The strongest purchases usually begin with the strongest inspections.
The Final Failure Prevention Matrix: Determining When Engine Replacement Becomes the Lowest-Risk Option
Preventive failure analysis is not about eliminating risk.
That is impossible.
It is about reducing risk before it becomes financially severe.
The Nissan Safari remains one of the most respected vehicles operating across the UAE.
Its durability is well known.
Yet durability should never be mistaken for invulnerability.
Every engine follows a reliability curve.
Every mechanical system deteriorates.
Every failure leaves clues.
Final Failure Assessment Matrix
| Reliability Indicator | Risk Level |
| Stable Temperatures | Low |
| Healthy Compression | Low |
| Minimal Oil Consumption | Low |
| Repeated Overheating | High |
| Compression Loss | High |
| Escalating Repairs | Very High |
The strongest ownership decisions occur before catastrophic failure.
Not after it.
For owners researching solutions through PartFinder UAE, the objective should not simply be finding a replacement engine.
The objective should be understanding why replacement became necessary in the first place.
Because every catastrophic failure has a history.
Every replacement-engine project has a root cause.
And almost every major failure begins with warning signs that once appeared too small to matter.
Those signs matter.
The costs associated with ignoring them usually prove that they did.
The most successful Nissan Safari owners are rarely the ones who spend the least.
They are the ones who identify failure pathways early enough to maintain control over the outcome.
That is the essence of preventive failure analysis.
And it is often the difference between a manageable repair bill and a replacement-engine project.